Predicting the future is not optional.
Data-driven decision-making is no longer a differentiating factor between companies but has become a necessity. In an increasingly competitive market, the ability to anticipate behaviors, trends, and future events can be the key factor that determines the success of a strategy.
It is evident that we must learn from the mistakes of past experiences, avoiding repeating them. It is also undeniable that predicting the outcomes of certain decisions before making them, based solely on historical data, represents a significant advantage. However, we humans struggle to learn from past mistakes, and we have an even greater difficulty in predicting the future with any degree of accuracy based on past information. This is often due to the countless possibilities and the complexity of the variables and how they interact with each other. It is precisely at this point that predictive Machine Learning models come into play.
What is a predictive model?
A predictive model, as the name suggests, is a mathematical model designed to predict an outcome (target variable) basedon the available data (input variables). To achieve this, supervised models can be used (where the models are trained with labeled data) and unsupervised models (where the models are trained with unlabeled data, being responsible for finding relationships between variables and grouping them coherently). If you would like to know more about supervised and unsupervised models, check out this article.
Currently, these models are used across various industries for multiple purposes, such as sales forecasting, fraud detection, disease diagnosis, among many others.
Types of predictive models
Most of the time when predictive models are discussed, regression or classification algorithms are mentioned. Although these are the most well-known, there are other models that also fall within the context of outcome prediction.
In this article, we will cover three of the most well-known types of predictive models, supported by practical examples of their application and explanatory charts.
Regression – Continuous Value Prediction:
Regression models are applied when the variable to be predicted (dependent variable) is numerical and continuous and has a relationship with the input variables (independent variables).
When this relationship is linear, we are dealing with a linear regression. If the relationship is not linear (for example, quadratic), we are dealing with a polynomial regression. These are two of the most commonly used types of regression.
Example:
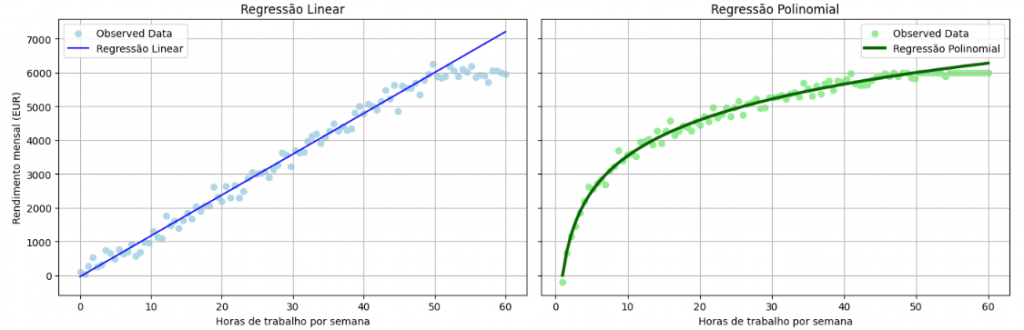
To illustrate these two types of regression, observe the following charts. In the chart on the left, we have a linear regression, where there is a constant relationship between the input variable (weekly working hours) and the dependent variable (monthly income). The chart on the right represents a polynomial regression, where income increases with the number of hours up to a certain point but tends to stabilize after 40 hours of weekly work.
Classification – Discrete Category Prediction:
Classification models are used when the variable to be predicted takes categorical values (for example: “yes” or “no”; “purchase” or “no purchase”). The goal of these models is to predict which class a new observation belongs to based on patterns identified in previous observations.
Classification can be binary (when the model predicts between two possible outcomes) or multiclass (when there are three or more possible outcomes).
Example:
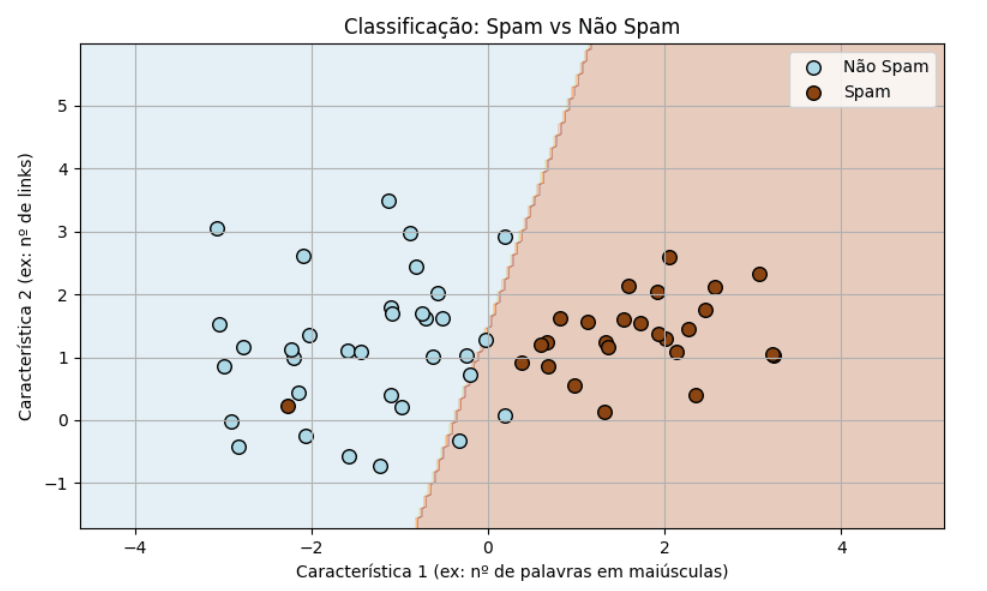
A classic case where classification models are applied is in the detection of spam in emails.
In this example, the model is trained with labeled email examples, using the variables “number of capitalized words” and “number of links.” Once trained, the model “draws” a decision boundary, illustrated in the chart below, which separates the observations considered “spam“from those considered **“not spam.”.
In this case, once trained, when receiving a new email, the model will predict whether it is spam or not spam., based on these two variables and, consequently, on the position of that email in the decision space shown below.
Clustering – Grouping Based on Similarities:
The clustering is used to segment observations into groups (clusters), based on common characteristics among these observations. The clusters are formed so that the observations within the same cluster are closer to each other than to observations from other clusters.
This clustering is especially useful because it allows the discovery of unknown and non-obvious patterns or relationships in the data.
Example:
A store online, with access to data about its customers, applied a model of clustering with the goal of discovering patterns or behavior profiles, obtaining the following result:
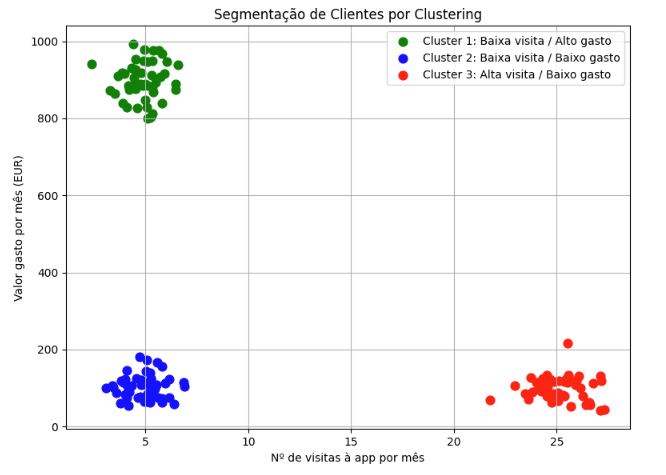
From the chart above, we can conclude that the model grouped the customers into three different groups:
- Low visit frequency and low spending;
- High visit frequency and low spending;
- Low visit frequency and high spending.
This segmentation can be used to develop personalized marketing campaigns for each customer group, increasing the effectiveness of communication and the return on these actions.
The power is in the data.
Whether through predicting numerical values, classifying into different categories, or clustering observations with similar characteristics, predictive models are powerful tools whose use has been increasing among companies looking to make the most of the data they possess.
The success of any predictive model depends on several factors, with the main one being data quality. No matter how well a model is built, its performance will never be exceptional if the data (whether training data, test data, or the data on which predictions will be made) is incomplete, outdated, or poorly structured.
At B2F, we help organizations structure their data, integrate multiple information sources, and maintain up-to-date and reliable databases, thus ensuring the necessary foundation for the success of their Machine Learning projects.