Financial models, what are they?
Financial analysis is one of the most important activities for the development and sustainability of any organization. This analysis is mainly used to assess the economic and financial situation of a company, not only at the present time, but also in the past and, above all, in the future. To this end, financial models are used, which are essential tools that allow the organization's current state to be interpreted and analyzed and future behaviors to be predicted, based on structured data and rigorous analysis. Financial models include different crucial components, such as the account structure, cost centers, cash flows, balance sheet, among others, which help to obtain a better financial understanding of the organization. Naturally, for a financial model to be effective and complete, it is essential to have access to reliable and detailed financial data, especially historical data, which are essential for retrospective analyses and future projections. With this, we can move on to a more detailed explanation of the formats responsible for this analysis.
Key documents that build a complete financial model
Balance
The financial statement is a document that reflects the financial position of a company at a given point in time. The balance sheet is divided into Assets, Liabilities and Equity.
- Assets – The organization’s assets and rights, such as: vehicles, computers…
- Liabilities – Obligations and debts, for example obligations to third parties, accounts payable…
- Equity – Net value of a company, difference between total assets and total liabilities.
For better analysis, the balance sheet can be divided by the months of the year and also by subsections of assets and liabilities. The image below shows an example of a balance sheet:
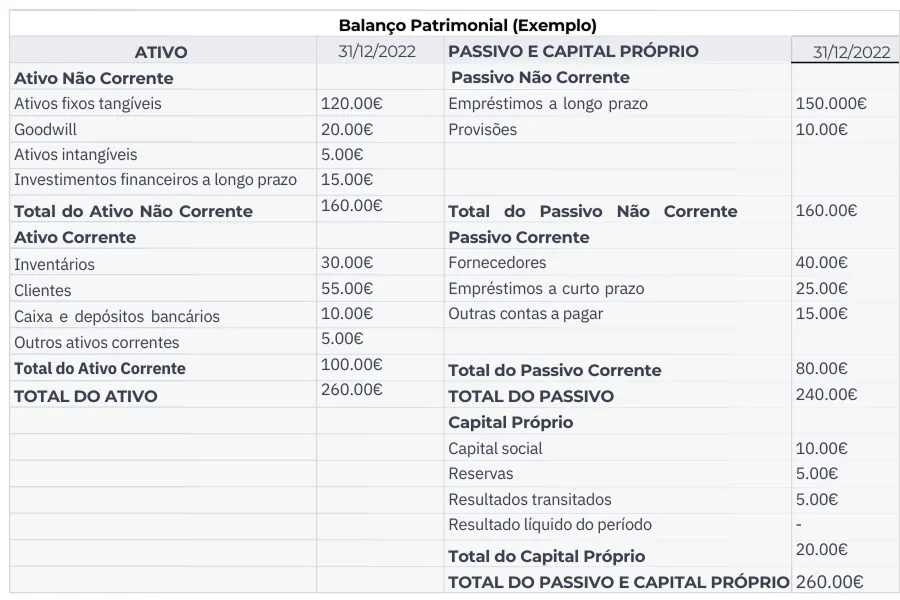
Balance sheet
In this section it also makes sense to refer to the trial balance, a report that supports the balance sheet and presents the balances of the accounting accounts in a given period, mainly used to check the correctness of the entries before preparing the Balance Sheet.
Income Statement
The second important format for a financial model is the “Income Statement”.
However, before moving on to a more detailed analysis of this section, it is important to understand the structure of the chart of accounts which, in this case, follows the Accounting Standardization System (SNC).
This structure organizes the accounts into classes and they can be detailed with different levels of disaggregation.
That is, in the SNC chart of accounts there are 7 classes that represent different purposes:
- Class 1 – Capital, Reserves and Retained Earnings
- Includes share capital, legal reserves and accumulated profits or losses.
- Class 2 – Third Party Debts
- Register customers, suppliers, accounts receivable and payable.
- Class 3 – Biological Inventories and Assets
- Includes stock of goods, raw materials and consumables.
- Class 4 – Financial Investments and Financing Obtained
- It includes loans, financial securities and investments.
- Class 5 – Liquid Financial Assets
- Bank accounts, cash and cash equivalents.
- Class 6 – Expenses and Losses
- Records operating expenses such as personnel costs, raw materials and external services.
- Class 7 – Income and Gains
- Includes revenue from sales, provision of services and other revenue.
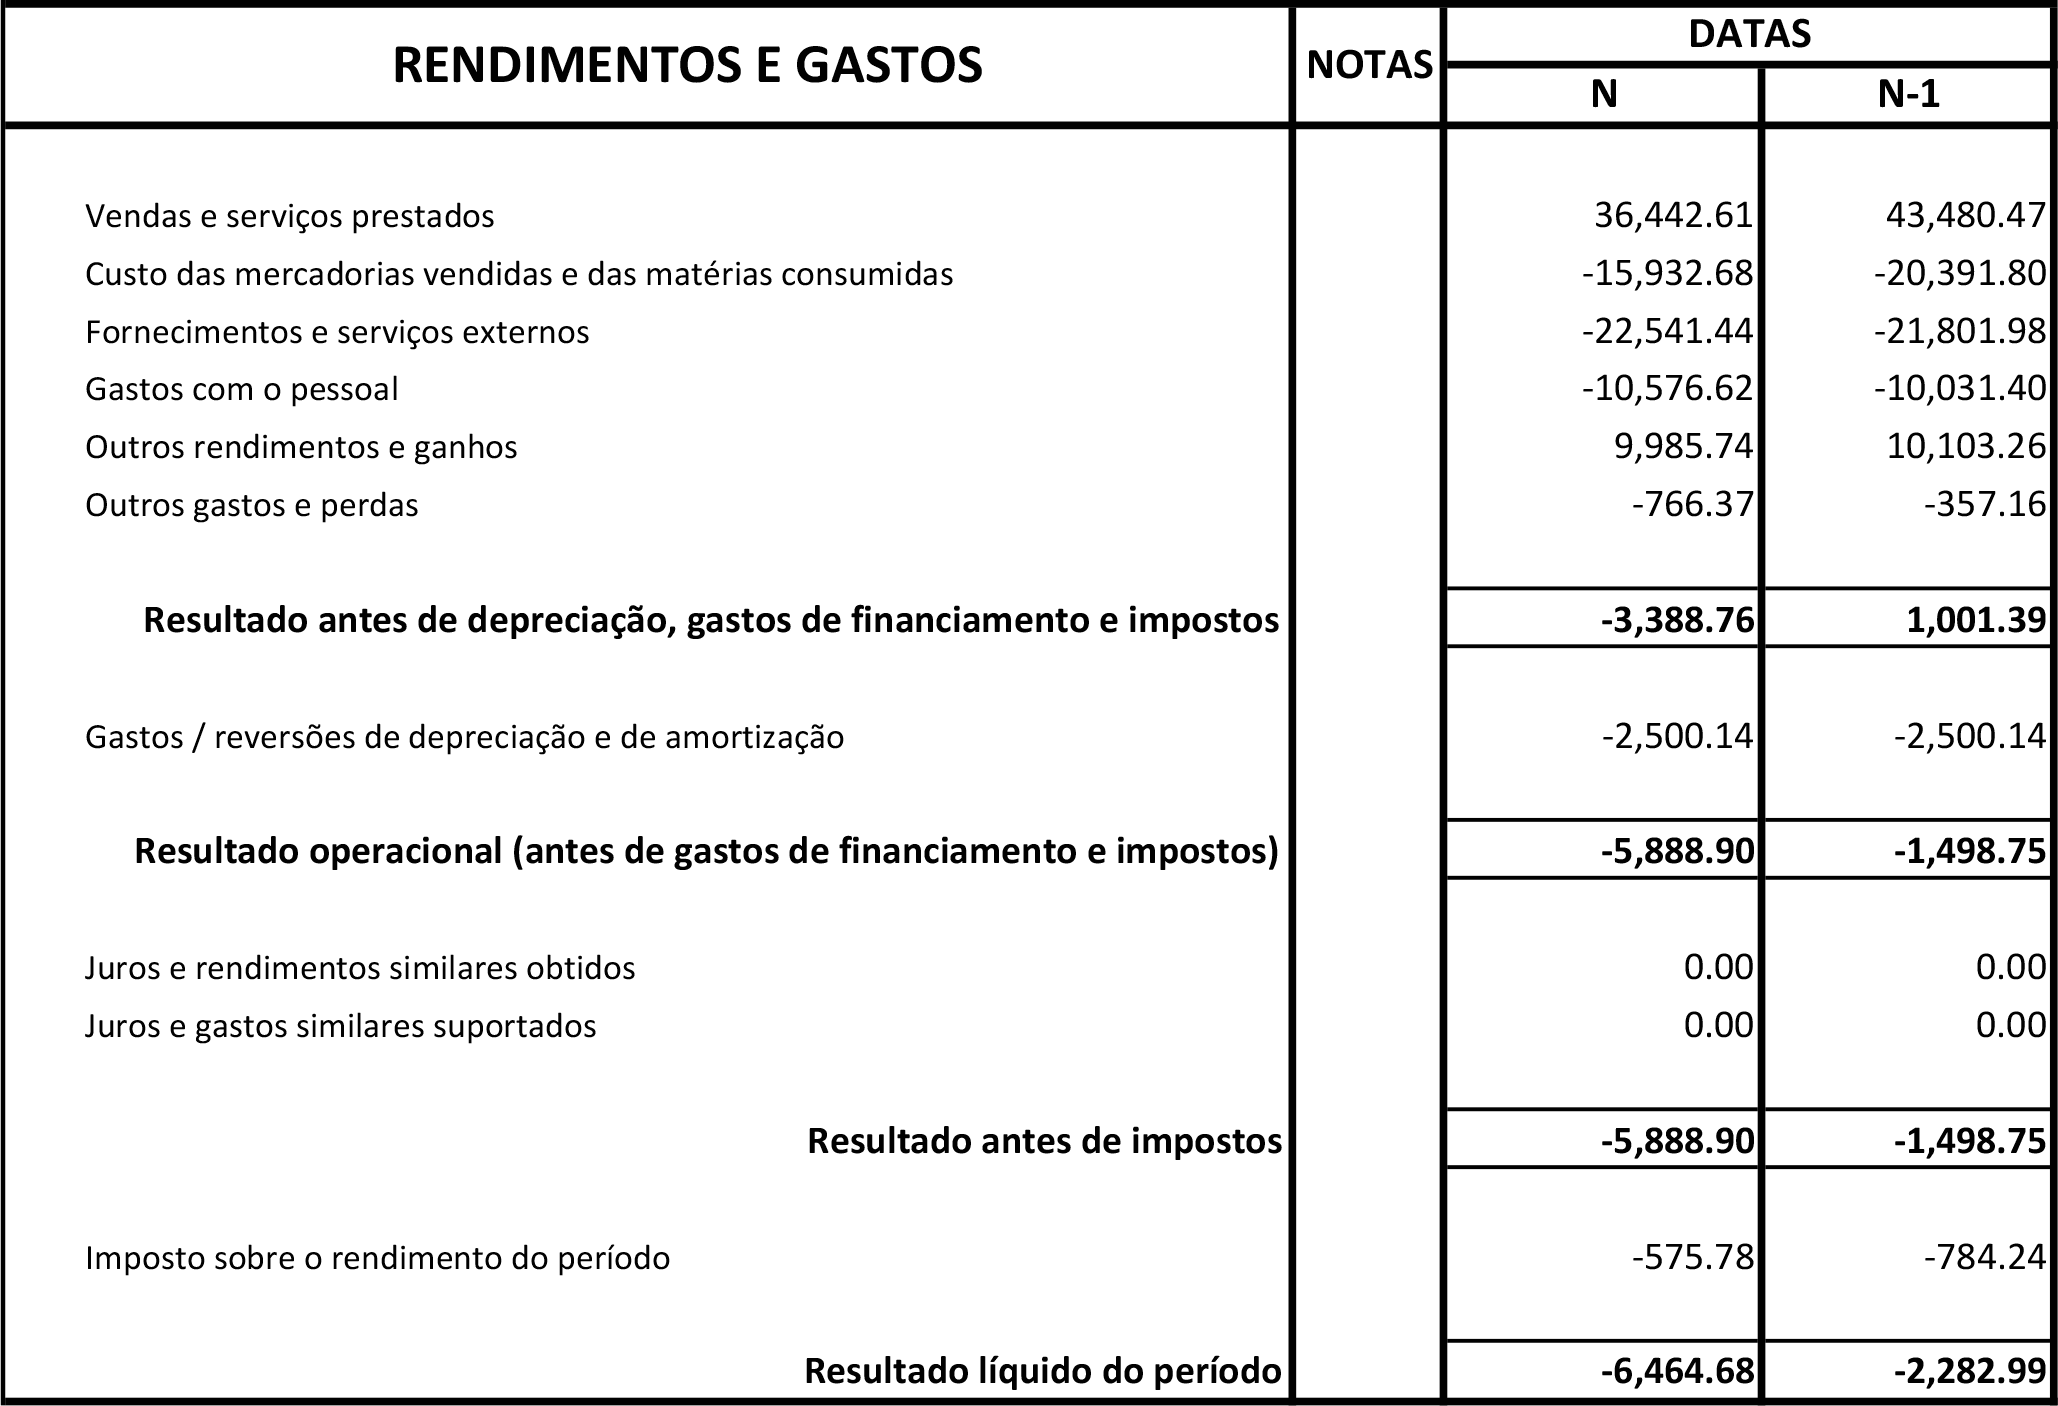
With this, in the income statement (translating into English “Profit & Losses”), **it is quickly clear that accounts 6 and 7 are used mainly. It is a document that summarizes all of the company's activity and shows whether the organization made a profit or loss in a given period. This way, with the document created, it is possible to record the accounting values of each item.
Headings
Headings are a very important topic in financial analysis, allowing interested parties, stakeholders or accountants to analyze and evaluate each one of them.
Headings are understood to be the specific categories or lines used to organize different types of income, expenses, assets, liabilities or other accounting elements.
In the image shown above, you can see the balance sheet items, such as “Tangible fixed assets”.
The main objective of the headings is to allow the structuring of financial information in a clear and understandable way, to control and analyze the executed budget and, in this way, to comply with accounting and legal standards.
The following image illustrates an example of a document with rubrics that can be used.
What is the role of B2F in building a financial analytical model?
B2F has extensive experience in developing financial analytical models, monitoring the entire process, from:
- Data extraction from multiple sources (parameterizations, CRMs, ERPs), regardless of their format — databases, APIs or files;
- Data transformation, adapting them to business needs and ensuring quality and consistency;
- Information consolidation in a Data Warehouse scalable, with the aim of creating a data model that is agnostic and independent of the source sources;
- Development of dashboards and analytical models, promoting efficient, intuitive and decision-oriented information consumption.
Building such a model, based on internal files or data extracted from an ERP, is often more complex than it seems at first glance.
The starting point: structuring information
The first step naturally involves visualizing and extracting all relevant data. This data will be organized into separate tables, according to their function.
As a general rule, the tables to be created or extracted include:
- Dimensions such as Companies, Departments, Activities, Sectors, Projects, among others;
- Accounts;
- Cost centers;
- Headings;
- Budgets;
- Movements;
- Cash flows.
The last columns concentrate numerical and temporal data (values and dates), while the first ones serve to characterize and contextualize this information.
In most cases, this data is not structured, organized or interconnected — and this is precisely where B2F plays a decisive role.
From Chaos to Structure: Creating Logic Where There Is None
After analysis and extraction, the process moves on to organizing the model: creating relationships between tables, disaggregating accounts and, whenever necessary, developing auxiliary tables that complete the final model.
Each organization has its own way of working with financial information. Sometimes, instead of there being a direct association between accounts and headings, more complex structures emerge, such as the one in the following image:
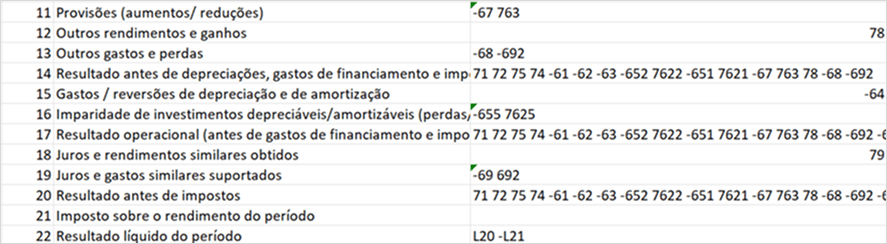
The first column indicates the analytical line of each heading, followed by the description and, finally, the disaggregated composition of the accounts that comprise it.
Some examples:
- A field like “67 68 69” represents the sum of the movements of accounts 67, 68 and 69 (and respective subaccounts);
- “4482..4495” corresponds to the interval between accounts 4482 and 4495 — that is, 4483, 4484, 4485, etc.;
- “L20-L21” indica a subtração entre os valores das linhas 20 e 21.
This type of structure, although understandable to humans, makes automated analysis difficult with tools such as Microsoft Excel or Power BI, as there is no direct correspondence between headings and movement records.
Automation and control: the power of the process
B2F uses procedures developed in SQL to disaggregate these accounts and establish the necessary links to the tables of numerical values. Although it is not an immediate process, the accumulated experience allows it to be made efficient, reliable and scalable.
With this work, we guarantee a automated calculation during process execution (ETL), ensuring that the balance sheet and income statement items are updated daily, without the need for manual intervention.
The end result: a unique, clear and functional model
Before this type of intervention, it is common to find companies with dozens of tables spread across the ERP, which are difficult to access and interpret, or multiple Excel files that are unrelated to each other.
After implementing the process, reality changes completely: a unique, structured and integrated model, where all data is processed and ready for analysis in a single location.
The following image shows an example of a model developed by B2F, with the appropriate associations and tables created throughout the process:
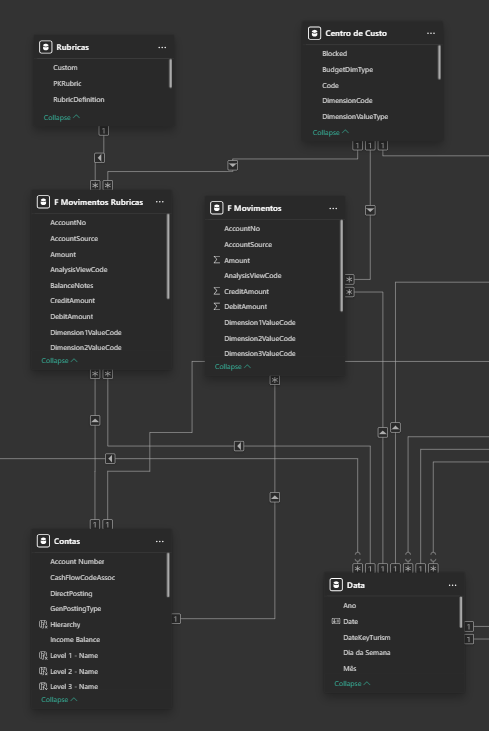
As you can see, the tables with numerical and temporal data are located in the center of the model, surrounded by tables that contextualize the information — such as headings, accounts, documents, etc.
Before vs After
The table below shows comparisons of a model before and after B2F developed it.
| Before | After |
|---|---|
| Poorly structured and dispersed information | Organized data, easy to access and view |
| Time-consuming analyses with limited access to data | Rapid analysis and intuitive development, with immediate access to any information needed |
| Data distributed across multiple files, making calculations difficult | Centralized, structured and standardized information in a single location |
| Documentation development for the model becomes complex and inefficient | Simple and straightforward creation of essential documents for the model |
| Too much time spent on data collection and consolidation | Automation of data integration and processing |
| High dependence on specific people to interpret the files | More autonomous teams and more agile processes |
| System difficult to scale with increasing data volume | Scalable model that allows you to easily integrate new data |
| Lack of global visibility over the business | Better support for strategic and operational management |